J Sainsbury PLC (SBRY)

Currency in GBP
295.00
+1.20(+0.41%)
Closed·
SBRY Scorecard
Full Analysis
Management has been aggressively buying back shares
High dividend Yield
SBRY is not included in our AI-picked strategies. See which stocks are.
Fair Value
Day's Range
294.00296.80
52 wk Range
223.60308.20
Key Statistics
Bid/Ask
288.00 / 300.00
Prev. Close
293.8
Open
294.6
Day's Range
294-296.8
52 wk Range
223.6-308.2
Volume
2.55M
Average Volume (3m)
7.62M
1-Year Change
8.25%
Fair Value
unlockUnlock
Fair Value Upside
unlockUnlock
SBRY Scorecardpro icon
Company’s Health
Unlock
Fair Value
Unlock Price
Fair Price
Upside
Price Target
307.08
Upside
+4.10%
Members' Sentiments
Bearish
Bullish
ProTips
Trading at a low P/E ratio relative to near-term earnings growth

J Sainsbury PLC News & Analysis

Show more

Technical Analysis

Summary
Strong Sell
Sell
Neutral
Buy
Strong Buy
Sell
Technical Indicators
Neutral
Moving Averages
Strong Sell

J Sainsbury PLC Company Profile

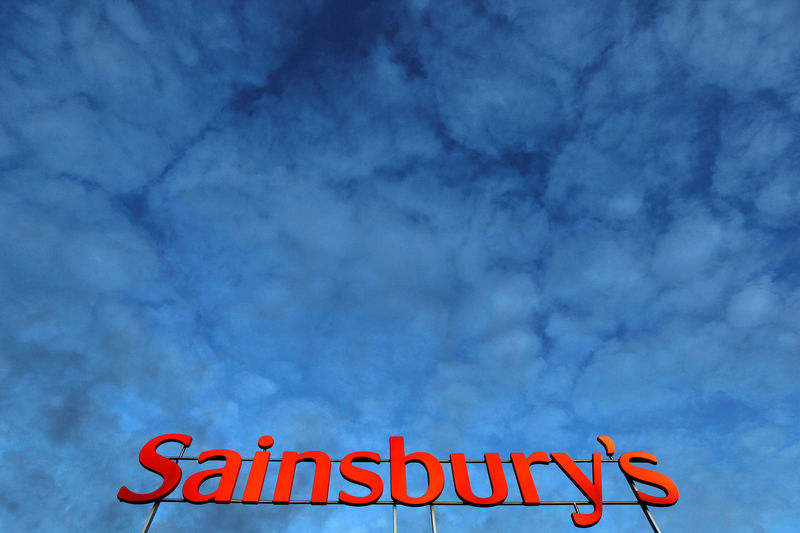
J Sainsbury plc, together with its subsidiaries, engages in the food, general merchandise and clothing retailing, and financial services activities in the United Kingdom. It operates through Retail and Financial Services segments. The company sells food, household, general merchandise, clothing, and fuel through convenience stores and supermarkets, as well as online channels. It also provides insurance services. The company offers its products under the Argos, Habitat, Tu, Smart Charge, Nectar, Nectar360, and Sainsbury’s Bank brands. The company was founded in 1869 and is based in London, the United Kingdom.

Compare SBRY to Peers and Sector

Metrics to compare
SBRY
Peers
Sector
Relationship
P/E Ratio
15.8x16.7x12.2x
PEG Ratio
0.21−0.020.03
Price/Book
1.0x2.1x1.5x
Price / LTM Sales
0.2x0.5x0.9x
Upside (Analyst Target)
5.1%23.6%17.1%
Fair Value Upside
Unlock11.8%10.7%Unlock

Analyst Ratings

6 Buy
5 Hold
1 Sell
Ratings:
12 analysts
Overall Consensus
Buy

Analysts 12-Month Price Target:

Average 307.08
(+4.10% Upside)

Dividends

Payout Ratio
Payout ratio (TTM)
Earnings retained
EPS 0.18%
Dividend Yield
4.63%
Industry Median 3.45%
Annualised payout
13.60
Paid unevenly
5-Years Growth
+32.74%
Growth Streak

Earnings

Latest Release
May 26, 2025
EPS / Forecast
0.10 / 0.1192
Revenue / Forecast
15.61B / 15.44B
EPS Revisions
Last 90 days

SBRY Income Statement

People Also Watch

332.00
MKS
+1.00%
101.10
TW
+0.70%
368.28
WPP
-6.00%
87.70
JD
+1.79%
5,434.0
RKT
-0.59%

FAQ

What Stock Exchange Does J Sainsbury Trade On?

J Sainsbury is listed and trades on the London Stock Exchange stock exchange.

What Is the Stock Symbol for J Sainsbury?

The stock symbol for J Sainsbury is "SBRY."

What Is the J Sainsbury Market Cap?

As of today, J Sainsbury market cap is 6.62B.

What Is J Sainsbury's Earnings Per Share (TTM)?

The J Sainsbury EPS (TTM) is 0.18.

When Is the Next J Sainsbury Earnings Date?

J Sainsbury will release its next earnings report on 05 Nov 2025.

From a Technical Analysis Perspective, Is SBRY a Buy or Sell?

Based on moving averages and other technical indicators, the daily buy/sell signal is Sell.

How Many Times Has J Sainsbury Stock Split?

J Sainsbury has split 1 times.

How Many Employees Does J Sainsbury Have?

J Sainsbury has 141517 employees.

What is the current trading status of J Sainsbury (SBRY)?

As of 08 Aug 2025, J Sainsbury (SBRY) is trading at a price of 295.00, with a previous close of 293.80. The stock has fluctuated within a day range of 294.00 to 296.80, while its 52-week range spans from 223.60 to 308.20.

What Is J Sainsbury (SBRY) Price Target According to Analysts?

The average 12-month price target for J Sainsbury is GBP307.083, with a high estimate of GBP330 and a low estimate of GBP265. 6 analysts recommend buying the stock, while 1 suggest selling, leading to an overall rating of Buy. The stock has an +4.10% Upside potential.
Risk Disclosure: Trading in financial instruments and/or cryptocurrencies involves high risks including the risk of losing some, or all, of your investment amount, and may not be suitable for all investors. Prices of cryptocurrencies are extremely volatile and may be affected by external factors such as financial, regulatory or political events. Trading on margin increases the financial risks.
Before deciding to trade in financial instrument or cryptocurrencies you should be fully informed of the risks and costs associated with trading the financial markets, carefully consider your investment objectives, level of experience, and risk appetite, and seek professional advice where needed.
Fusion Media would like to remind you that the data contained in this website is not necessarily real-time nor accurate. The data and prices on the website are not necessarily provided by any market or exchange, but may be provided by market makers, and so prices may not be accurate and may differ from the actual price at any given market, meaning prices are indicative and not appropriate for trading purposes. Fusion Media and any provider of the data contained in this website will not accept liability for any loss or damage as a result of your trading, or your reliance on the information contained within this website.
It is prohibited to use, store, reproduce, display, modify, transmit or distribute the data contained in this website without the explicit prior written permission of Fusion Media and/or the data provider. All intellectual property rights are reserved by the providers and/or the exchange providing the data contained in this website.
Fusion Media may be compensated by the advertisers that appear on the website, based on your interaction with the advertisements or advertisers
© 2007-2025 - Fusion Media Limited. All Rights Reserved.