Five things to watch in markets in the week ahead
- Let's take a look at up to 8 reasons why a dip-buying strategy could be the best way to take advantage of bullish momentum.
- Meanwhile, gold is benefiting from record central bank buying, apart from other catalysts.
- Where could oil go in the coming months and why? We'll look at the reasons behind it.
- Do you invest in the stock market and want to get the most out of your portfolio? Try InvestingPro! Subscribe HERE and take advantage of up to 38% discount for a limited time on your 1-year plan!
In 2024, we're witnessing remarkable milestones across various markets. Stock markets like the S&P 500, Dow Jones Industrial Average, Nasdaq, DAX, and Nikkei 225 are hitting record highs, alongside surges in Bitcoin, gold, and other sectors like cocoa, coffee, and the USD/JPY pair.
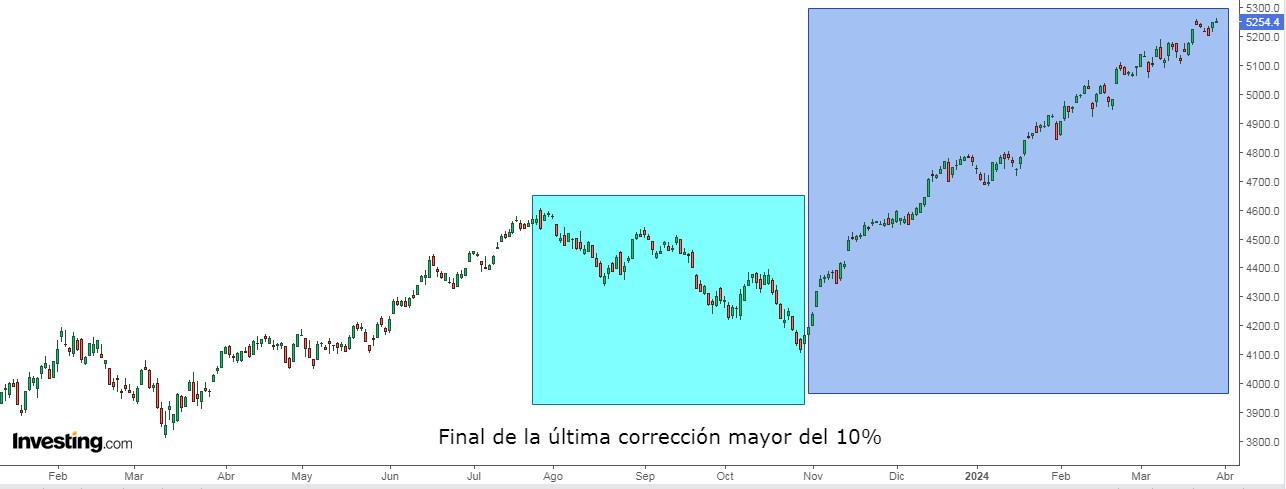
The S&P 500 has surged by 10% in the first quarter, marking its strongest start since 2019, achieving 21 all-time highs. Interestingly, this rise isn't solely driven by tech stocks; 10 out of the 11 sectors within the S&P 500 have seen gains.
With the S&P 500 up by 25% in 2023 and another 10% in the first three months of 2024, some investors might feel apprehensive. However, several factors offer reassurance:
- Over 77% of S&P 500 stocks are trading above their 200-day moving average, indicating significant strength.
- Since the October 27 low, the S&P 500 hasn't experienced a closing decline of more than -2%, marking the longest streak without such a decline in over five years. Historically, this has led to positive gains.
- In the past five years, there have been 21 declines of -5% or more and five corrections of at least -10%. So far in 2024, we haven't seen either, suggesting potential opportunities to buy on dips.
- White House election years tend to be bullish, regardless of the political party in power.
- The S&P 500 has risen in 17 out of the last 21 weeks, a unique trend in history, often followed by strong gains.
- When the S&P 500 rises consistently in the first three months of the year, it tends to continue rising for the rest of the year.
- Historically, when the index rises from November to March, it extends the rise for at least another year.
- Analysis of corrections over the past 60 years suggests they're typically driven by rising unemployment or bond yields, or external factors. These factors appear less likely this year.
Overall, despite any potential concerns, historical trends and current market indicators suggest a positive outlook for the S&P 500 in 2024.

Could Apple Drag S&P 500 Lower?
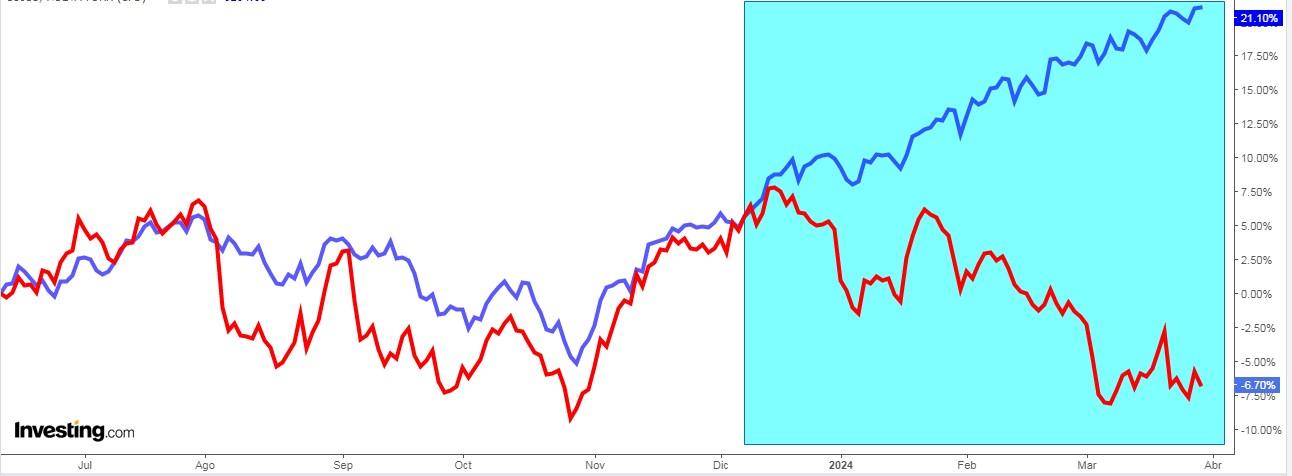
Apple (NASDAQ:AAPL) has experienced a decline of 10.93% in 2024, leading to questions about the impact on the S&P 500 if Apple's stock continues to fall.
While some may argue that the S&P 500's performance relies heavily on Apple due to its status as the largest company in the world, the reality is different.
Despite Apple's decline, the S&P 500 has seen a significant rise of +21% over the past 200 trading days.
During this period, Apple's shares have dropped by more than -6%, marking a considerable 27.2 percentage point gap between the two, the widest since October 2013.

Who are the most bullish on the S&P 500 in terms of where it will rise between now and the end of the year?
- Société Générale 5500
- Bank of America 5400
- Yardeni Research 5400
- Barclays 5300
- Goldman Sachs 5200
- UBS 5200
- Oppenheimer 5200
- Fundstrat 5200
And the less optimistic?
- RBC 5150
- Citi 5100
- Deutsche Bank 5100
- BMO Capital Markets 5100
- Wells Fargo Investment 4900
- Morgan Stanley) 4500
- JPMorgan 4200
QQQ Birthday
The famous Invesco QQQ Trust (NASDAQ:QQQ), which replicates the Nasdaq 100 index, celebrated its 25th anniversary on March 10.
Despite an -83% drop between March 2000 and October 2002, in its first 25 years of activity, the ETF posted a total return of +905.7% (an annualized return of +9.67%).

Gold Could Soar on Central Bank Purchases
Central banks are buying gold generously. The latest data from the World Gold Council indicate that they have chained 14 years of gold purchases bringing their holdings to over 36,700 tonnes.
The last two years, moreover, have been particularly intense in terms of acquisitions amounting to 1,000 tons in both years and have broken all recent records.
In addition, central banks account for almost 20% of all gold in circulation.
China, Russia, Turkey, and India are the countries that have increased their gold reserves the most.
The relentless pace of central bank purchases is one of the reasons behind their record highs.
Why Crude Oil Could Continue to Rise
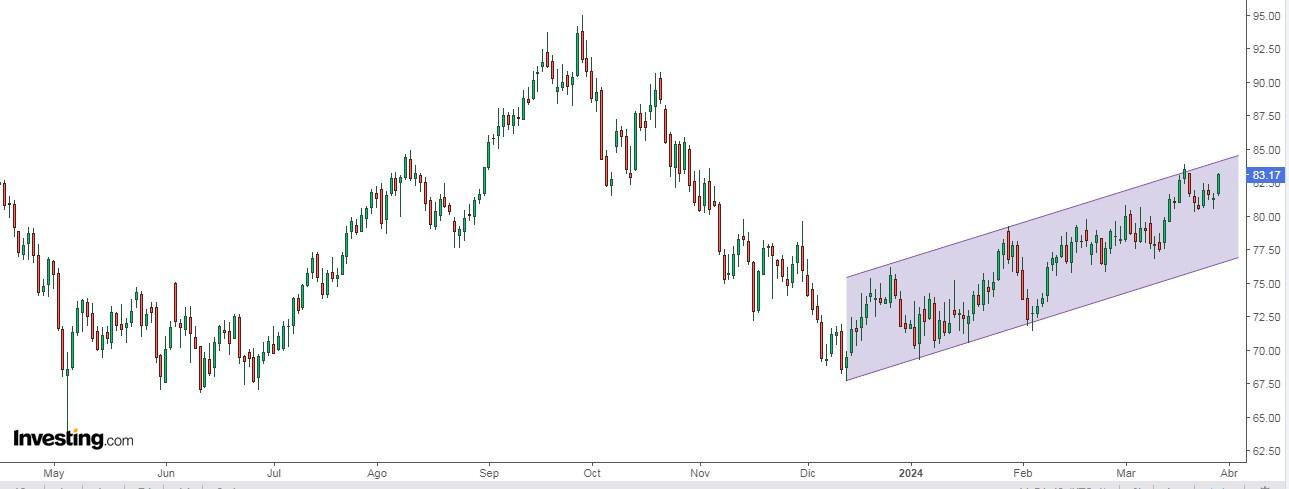
Market consensus expects oil prices to remain bullish through the summer months. There are two reasons for this:
- Russia's decision to cut production.
- The possibility that OPEC will extend its production cuts in June until the end of the year.
The forecast from the Reuters survey of institutional managers is that oil prices Brent could rise to $90-95 between now and September.

Stock Market Rankings 2024
Here's how the world's major stock exchanges are doing so far in 2024:
- Nikkei Japanese +19.03%
- FTSE MIB Italian +14.49%
- Euro Stoxx 50 +12,43%
- Dax German +10.39%.
- S&P 500 +10.16%.
- Ibex 35 Spanish +9.63%
- Nasdaq +9,11%
- Cac French +8.78%
- Dow Jones +5,62%
- FTSE 100 British +2.84%
Investor sentiment (AAII)
Bullish sentiment, i.e. expectations that stock prices will rise over the next six months, rose 6.8 percentage points to 50%.This is unusually high and remains above its historical average of 37.5%.
Bearish sentiment, i.e., expectations that stock prices will fall over the next six months, fell 4.7 percentage points to 22.4% and remains below its historical average of 31%.
***
Are you investing in the stock market? To determine when and how to get in or out, try InvestingPro.
Take advantage HERE & NOW! Click HERE, choose the plan you want for 1 or 2 years, and take advantage of your DISCOUNTS.
Get from 10% to 50% by applying the code INVESTINGPRO1. Don't wait any longer!
With it, you will get:
- ProPicks: AI-managed portfolios of stocks with proven performance.
- ProTips: digestible information to simplify a large amount of complex financial data into a few words.
- Advanced Stock Finder: Search for the best stocks based on your expectations, taking into account hundreds of financial metrics.
- Historical financial data for thousands of stocks: So that fundamental analysis professionals can delve into all the details themselves.
- And many other services, not to mention those we plan to add in the near future.
Act fast and join the investment revolution - get your OFFER HERE!
Disclaimer: The author does not own any of these shares. This content, which is prepared for purely educational purposes, cannot be considered as investment advice.

