UBS cuts Shell to “neutral,” warns stock ‘no longer cheap’ after strong rally
- Let's see how we can take advantage of the fact that the exposure of 6 stocks in the S&P 500 is 30% and in the Nasdaq is 40%.
- While June is historically not a good month for stocks, that could change this year.
- We will also take a look at how Nvidia's stock split could affect the stock price going ahead.
- Want to invest by taking advantage of market opportunities? Don't hesitate to try InvestingPro. Subscribe HERE and get almost 40% off for a limited time on your 1-year plan!
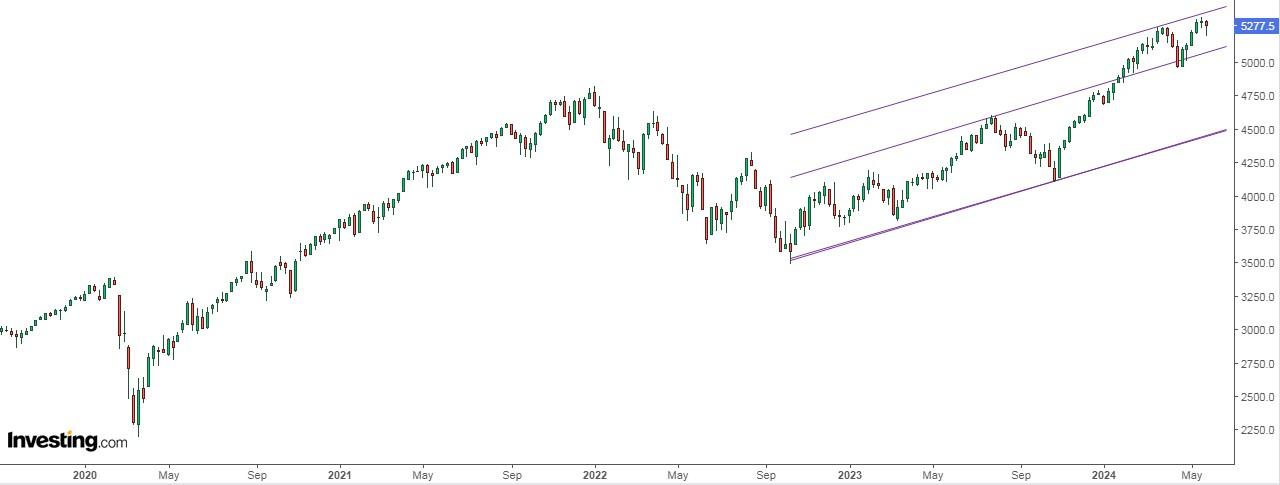
The S&P 500 surprised many by ending May with a nearly 5% gain. This is noteworthy, considering it's only happened six times in the past 40 years.

Here's what historical data reveals about the market's potential performance in the coming months:
- June: The S&P 500 has historically trended upwards in June following a strong May, with an average gain of 1.2% in five out of the six instances.
- Full Year: Looking at the entire year after a positive May, the average return for the S&P 500 jumps to a significant 8.6%.
Election Year Boost for June and August?
Interestingly, June and August are typically considered weaker-performing months for the market. However, during election years, these months experience a historical uptick, averaging around a 1.3% return each.
S&P 500 Concentration Reaches New Highs
Currently, just six companies – Microsoft (NASDAQ:MSFT), Apple (NASDAQ:AAPL), Nvidia (NASDAQ:NVDA), Alphabet (NASDAQ:GOOG), Amazon (NASDAQ:AMZN), and Meta Platforms (NASDAQ:META) – represent a whopping 30% of the index. This concentration extends to other major indexes as well, with these same companies making up 18% of the MSCI World and 40% of the Nasdaq 100.

For perspective, the average weight of the top 6 companies in the S&P 500 over the past 30 years was only 10%. Even the tech bubble of 2000 saw a peak of 20%, and companies like Cisco (NASDAQ:CSCO), Intel (NASDAQ:INTC), General Electric Company (NYSE:GE), Exxon Mobil (NYSE:XOM), and Walmart (NYSE:WMT) didn't hold the same level of dominance as the current "Big 6."
This concentration is further emphasized by analyzing the top five holdings of hedge funds at the end of Q1. Notably, Tesla (NASDAQ:TSLA) and Apple, previously prominent players, are now largely absent from these top positions.
Looking to Capitalize on Higher Concentration in S&P 500 Stocks?
As mentioned a few months ago, the Roundhill Magnificent Seven ETF (NASDAQ:MAGS) offers a convenient way to gain exposure to these top performers.
Launched in April 2023, MAGS tracks the Magnificent Seven – the six most heavily weighted S&P 500 stocks we just discussed, plus Tesla. This ETF boasts a low 0.29% fee and automatically rebalances quarterly to maintain equal weighting among the Magnificent 7, ensuring consistent exposure to these market leaders.
Nvidia Stock Soars After Strong Results and Planned Split
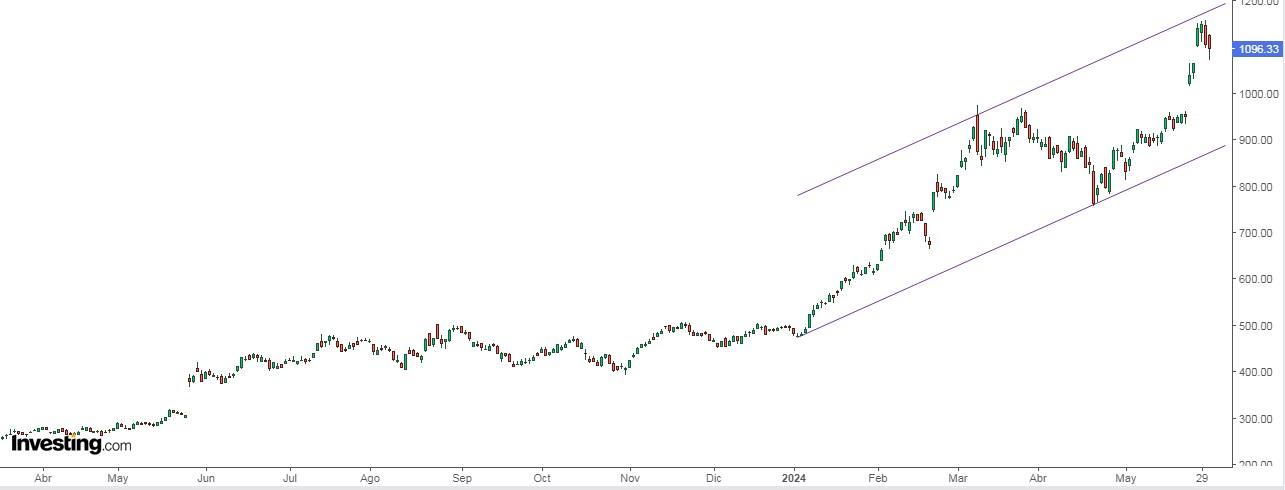
Fueled by both positive earnings and a proposed 10:1 stock split, Nvidia's stock price surged after the company announced impressive financial results. Not only did they surpass market expectations, but they also unveiled a significant 150% increase in their dividend.

This stock split aims to make individual shares more accessible to a wider range of investors. By increasing the number of outstanding shares while reducing their individual value, investors can purchase shares at a lower entry point.
While the overall value of the company remains unchanged, the psychological effect of a lower share price can entice new investment.
However, historical data paints a mixed picture. While stock splits often act as a bullish catalyst with an average return of 24% a year later, it's important to remember that 30% of companies experience negative returns within the same timeframe.
Ranking of the Stock Exchanges in 2024
This is the ranking of the main stock exchanges so far this year:
- Nikkei Japanese 16.01%.
- FTSE MIB Italian 14%
- Ibex 35 Spanish 12.6%
- Nasdaq 11.5%
- Dax German 11%
- Euro Stoxx 50 10.8%
- S&P 500 10.6%
- FTSE 100 British 7.01%
- Hang Seng Chinese 6.06%
- Cac French 5.96%
- Dow Jones 2.1%
Investor sentiment (AAII)
Bullish sentiment, i.e. expectations that stock prices will rise over the next six months, is at 39% and remains above its historical average of 37.5%.
Bearish sentiment, i.e. expectations that stock prices will fall over the next six months, is at 26.7%, below its historical average of 31%.
***
Become a Pro: Sign up now! CLICK HERE to join the PRO Community with a significant discount.
Disclaimer: This article is written for informational purposes only; it does not constitute a solicitation, offer, advice, counsel or recommendation to invest as such it is not intended to incentivize the purchase of assets in any way. I would like to remind you that any type of asset, is evaluated from multiple perspectives and is highly risky and therefore, any investment decision and the associated risk remains with the investor.

