Shenghe Resources Holding Co Ltd (600392)

Currency in CNY
20.50
-1.26(-5.79%)
Closed·
600392 Scorecard
Full Analysis
Net income is expected to grow this year
600392 is not included in our AI-picked strategies. See which stocks are.
Fair Value
Day's Range
20.4521.69
52 wk Range
7.3824.65
Key Statistics
Bid/Ask
20.51 / 20.52
Prev. Close
21.76
Open
21.69
Day's Range
20.45-21.69
52 wk Range
7.38-24.65
Volume
228.25M
Average Volume (3m)
122.19M
1-Year Change
149.09%
Fair Value
unlockUnlock
Fair Value Upside
unlockUnlock
600392 Scorecardpro icon
Company’s Health
Unlock
Fair Value
Unlock Price
Fair Price
Upside
Price Target
15.54
Downside
-24.20%
Members' Sentiments
Bearish
Bullish
ProTips
Stock has taken a big hit over the last week
Show more

Technical Analysis

Summary
Strong Sell
Sell
Neutral
Buy
Strong Buy
Strong Sell
Technical Indicators
Strong Sell
Moving Averages
Sell

Shenghe Resources Holding Co Ltd Company Profile

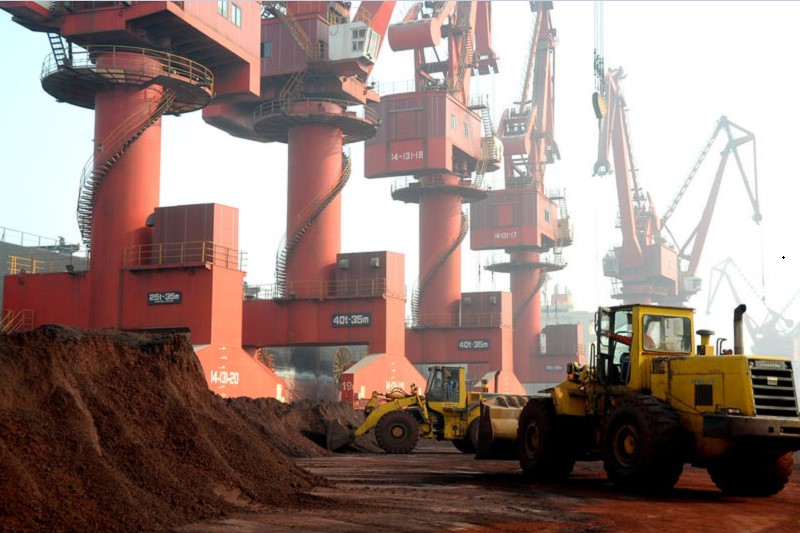
Shenghe Resources Holding Co., Ltd engages in the research and development, production, and supply of rare earth and related products in China and internationally. The company offers rare earth concentrates, compounds, and metals. It also offers mineral sands comprising of titanium concentrate, rutile, kyanite, garnet, monazite, and zircon sands. The company serves new energy, new materials, energy conservation, environmental protection, aerospace, military industry, electronics, and other sectors. The company was formerly known as Taiyuan Tiancheng Science & Technology Co., Ltd and changed its name to Shenghe Resources Holding Co., Ltd in January 2013. Shenghe Resources Holding Co., Ltd was founded in 1998 and is based in Chengdu, China.

Employees
2514
Market
China

Compare 600392 to Peers and Sector

Metrics to compare
600392
Peers
Sector
Relationship
P/E Ratio
60.8x39.9x2.2x
PEG Ratio
0.040.240.00
Price/Book
3.7x2.0x1.6x
Price / LTM Sales
3.1x1.8x1.3x
Upside (Analyst Target)
−24.2%4.5%22.7%
Fair Value Upside
Unlock−2.3%2.4%Unlock

Analyst Ratings

2 Buy
0 Hold
0 Sell
Ratings:
2 analysts
Overall Consensus
Strong Buy

Analysts 12-Month Price Target:

Average 15.54
(-24.20% Downside)

Dividends

Payout Ratio
Payout ratio (TTM)
Earnings retained
EPS 0.34%
Dividend Yield
0.59%
Industry Median 2.08%
Annualised payout
0.12
Paid unevenly
5-Years Growth
-
Growth Streak

Earnings

Latest Release
Apr 29, 2025
EPS / Forecast
0.10 / --
Revenue / Forecast
2.99B / --
EPS Revisions
Last 90 days

600392 Income Statement

People Also Watch

208.33
LEU
-3.28%
595.00
ASML
-2.95%
235.50
TCFP
-0.13%
24.08
AMG
-2.90%

FAQ

What Stock Exchange Does Shenghe Resources Trade On?

Shenghe Resources is listed and trades on the Shanghai Stock Exchange stock exchange.

What Is the Stock Symbol for Shenghe Resources?

The stock symbol for Shenghe Resources is "600392."

What Is the Shenghe Resources Market Cap?

As of today, Shenghe Resources market cap is 35.93B.

What Is Shenghe Resources's Earnings Per Share (TTM)?

The Shenghe Resources EPS (TTM) is 0.34.

When Is the Next Shenghe Resources Earnings Date?

Shenghe Resources will release its next earnings report on 26 Oct 2025.

From a Technical Analysis Perspective, Is 600392 a Buy or Sell?

Based on moving averages and other technical indicators, the daily buy/sell signal is Strong Buy.

How Many Times Has Shenghe Resources Stock Split?

Shenghe Resources has split 4 times.

How Many Employees Does Shenghe Resources Have?

Shenghe Resources has 2514 employees.

What is the current trading status of Shenghe Resources (600392)?

As of 03 Aug 2025, Shenghe Resources (600392) is trading at a price of 20.50, with a previous close of 21.76. The stock has fluctuated within a day range of 20.45 to 21.69, while its 52-week range spans from 7.38 to 24.65.
Risk Disclosure: Trading in financial instruments and/or cryptocurrencies involves high risks including the risk of losing some, or all, of your investment amount, and may not be suitable for all investors. Prices of cryptocurrencies are extremely volatile and may be affected by external factors such as financial, regulatory or political events. Trading on margin increases the financial risks.
Before deciding to trade in financial instrument or cryptocurrencies you should be fully informed of the risks and costs associated with trading the financial markets, carefully consider your investment objectives, level of experience, and risk appetite, and seek professional advice where needed.
Fusion Media would like to remind you that the data contained in this website is not necessarily real-time nor accurate. The data and prices on the website are not necessarily provided by any market or exchange, but may be provided by market makers, and so prices may not be accurate and may differ from the actual price at any given market, meaning prices are indicative and not appropriate for trading purposes. Fusion Media and any provider of the data contained in this website will not accept liability for any loss or damage as a result of your trading, or your reliance on the information contained within this website.
It is prohibited to use, store, reproduce, display, modify, transmit or distribute the data contained in this website without the explicit prior written permission of Fusion Media and/or the data provider. All intellectual property rights are reserved by the providers and/or the exchange providing the data contained in this website.
Fusion Media may be compensated by the advertisers that appear on the website, based on your interaction with the advertisements or advertisers
© 2007-2025 - Fusion Media Limited. All Rights Reserved.