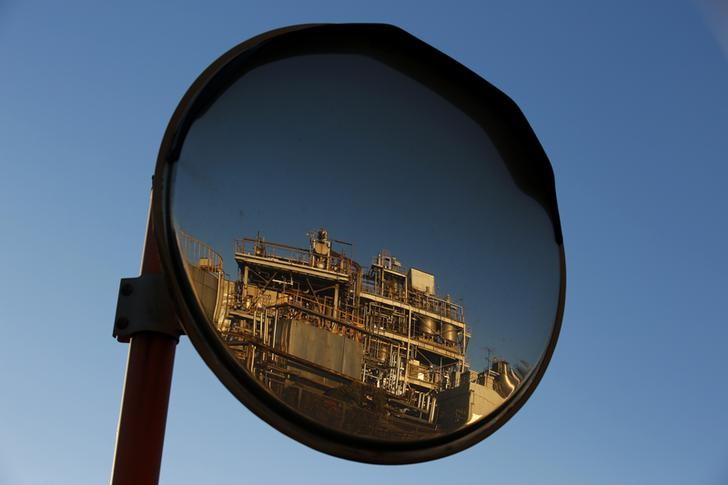
Transocean Ltd (RIG)

Currency in USD
3.015
+0.105(+3.61%)
Real-time Data·
RIG Scorecard
Full Analysis
Trading at a low Price / Book multiple
RIG is not included in our AI-picked strategies. See which stocks are.
Fair Value
Day's Range
2.9603.160
52 wk Range
1.9705.325
Key Statistics
Prev. Close
2.91
Open
2.97
Day's Range
2.96-3.16
52 wk Range
1.97-5.325
Volume
31.38M
Average Volume (3m)
38.25M
1-Year Change
-41.92%
Book Value / Share
10.32
Fair Value
unlockUnlock
Fair Value Upside
unlockUnlock
RIG Scorecardpro icon
Company’s Health
Unlock
Fair Value
Unlock Price
Fair Price
Upside
Price Target
3.964
Upside
+31.49%
Members' Sentiments
Bearish
Bullish
ProTips
Stock price movements are quite volatile

Transocean Ltd News & Analysis

Show more

Technical Analysis

Summary
Strong Sell
Sell
Neutral
Buy
Strong Buy
Strong Buy
Technical Indicators
Strong Buy
Moving Averages
Buy

Transocean Ltd Company Profile

Transocean Ltd., together with its subsidiaries, provides offshore contract drilling services for oil and gas wells in Switzerland and internationally. The company contracts mobile offshore drilling rigs, related equipment, and work crews to drill oil and gas wells. It also operates a fleet of mobile offshore drilling units, consisting of ultra-deepwater floaters and harsh environment floaters. It serves integrated energy companies and their affiliates, government-owned or government-controlled energy companies, and other independent energy companies. Transocean Ltd. was founded in 1926 and is based in Steinhausen, Switzerland.

Transocean Ltd SWOT Analysis


Offshore Challenges
Transocean navigates a volatile offshore drilling market, balancing high-value contracts with idle rig concerns amid industry consolidation and uncertain demand
Financial Crossroads
Despite a $3.74B market cap and $3.3B revenue, Transocean faces near-term losses with EPS estimates of -$0.23 for FY1, potentially turning positive at $0.14 in FY2
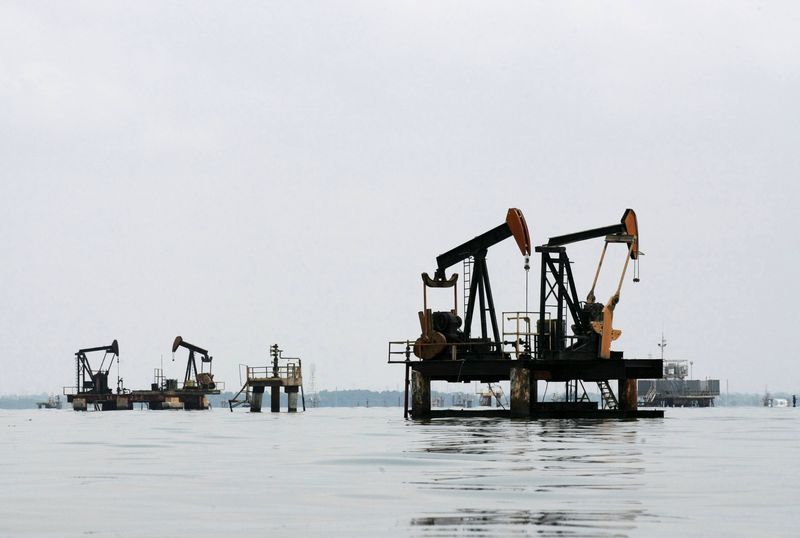
Strategic Fleet Assets
Explore how Transocean's advanced ultra-deepwater fleet positions it for premium contracts, exemplified by the $635,000 daily rate BP agreement for Deepwater Atlas
Future Horizons
Delve into analysts' mixed outlook, with price targets around $6, as Transocean aims to capitalize on projected increased offshore activity by 2026
Read full SWOT analysis

Transocean Ltd Earnings Call Summary for Q4/2024

  • Q4 2024 EPS of -$0.09 missed forecast; contract drilling revenues of $952 million fell short of expectations
  • Adjusted EBITDA of $323 million for Q4; full-year revenue reached $3.5 billion, up 24.44% year-over-year
  • Stock price increased 0.14% after-hours despite earnings miss; trading near 52-week low with $3.1 billion market cap
  • Company achieved best-ever safety performance; projects 2025 contract drilling revenues of $3.85-$3.95 billion
  • Anticipates tightening market in 2026-2027 due to rising deepwater CapEx; exploring cost structure improvements
Last Updated: 18/02/2025, 16:12
Read Full Transcript

Compare RIG to Peers and Sector

Metrics to compare
RIG
Peers
Sector
Relationship
P/E Ratio
−1.9x10.6x4.9x
PEG Ratio
0.01−0.090.00
Price/Book
0.3x1.2x1.1x
Price / LTM Sales
0.8x0.8x1.1x
Upside (Analyst Target)
37.5%12.8%25.0%
Fair Value Upside
Unlock25.3%9.8%Unlock

Analyst Ratings

4 Buy
9 Hold
1 Sell
Ratings:
14 analysts
Overall Consensus
Neutral

Analysts 12-Month Price Target:

Average 3.964
(+31.49% Upside)

Earnings

Latest Release
Aug 04, 2025
EPS / Forecast
-- / -0.0041
Revenue / Forecast
988.00M / 969.61M
EPS Revisions
Last 90 days

RIG Income Statement

People Also Watch

67.23
MP
-1.69%
109.41
CRWV
-2.18%
51.51
EQT
-0.04%
6.820
BBAI
-3.13%
433.97
LMT
+1.34%

FAQ

What Stock Exchange Does Transocean Trade On?

Transocean is listed and trades on the New York Stock Exchange stock exchange.

What Is the Stock Symbol for Transocean?

The stock symbol for Transocean is "RIG."

What Is the Transocean Market Cap?

As of today, Transocean market cap is 2.83B.

What Is Transocean's Earnings Per Share (TTM)?

The Transocean EPS (TTM) is -1.71.

When Is the Next Transocean Earnings Date?

Transocean will release its next earnings report on 02 Nov 2025.

From a Technical Analysis Perspective, Is RIG a Buy or Sell?

Based on moving averages and other technical indicators, the daily buy/sell signal is Strong Buy.

How Many Times Has Transocean Stock Split?

Transocean has split 2 times.

How Many Employees Does Transocean Have?

Transocean has 5470 employees.

What is the current trading status of Transocean (RIG)?

As of 06 Aug 2025, Transocean (RIG) is trading at a price of 3.02, with a previous close of 2.91. The stock has fluctuated within a day range of 2.96 to 3.16, while its 52-week range spans from 1.97 to 5.33.

What Is Transocean (RIG) Price Target According to Analysts?

The average 12-month price target for Transocean is USD3.96429, with a high estimate of USD5.5 and a low estimate of USD2.5. 4 analysts recommend buying the stock, while 1 suggest selling, leading to an overall rating of Neutral. The stock has an +31.49% Upside potential.
Risk Disclosure: Trading in financial instruments and/or cryptocurrencies involves high risks including the risk of losing some, or all, of your investment amount, and may not be suitable for all investors. Prices of cryptocurrencies are extremely volatile and may be affected by external factors such as financial, regulatory or political events. Trading on margin increases the financial risks.
Before deciding to trade in financial instrument or cryptocurrencies you should be fully informed of the risks and costs associated with trading the financial markets, carefully consider your investment objectives, level of experience, and risk appetite, and seek professional advice where needed.
Fusion Media would like to remind you that the data contained in this website is not necessarily real-time nor accurate. The data and prices on the website are not necessarily provided by any market or exchange, but may be provided by market makers, and so prices may not be accurate and may differ from the actual price at any given market, meaning prices are indicative and not appropriate for trading purposes. Fusion Media and any provider of the data contained in this website will not accept liability for any loss or damage as a result of your trading, or your reliance on the information contained within this website.
It is prohibited to use, store, reproduce, display, modify, transmit or distribute the data contained in this website without the explicit prior written permission of Fusion Media and/or the data provider. All intellectual property rights are reserved by the providers and/or the exchange providing the data contained in this website.
Fusion Media may be compensated by the advertisers that appear on the website, based on your interaction with the advertisements or advertisers
© 2007-2025 - Fusion Media Limited. All Rights Reserved.